How much do you know about the year-end review data analysis of clothing stores?
A store's annual revenue data is collected at the end of the year. Now, the editor will explain in advance how to analyze the retail clothing store's year-end review data.
We all know that a retail clothing store's year-end review relies on a full year's worth of data. The store manager's task is to collect data, conduct a detailed analysis, and finally summarize the experience. So, what are the specific steps for doing this?
First, the store manager needs to master all the numbers.
Don't underestimate the power of data; it can directly affect your store's performance.
A friend of mine quit his job to start a small retail clothing store, but closed it in less than half a year. I asked him how much customer traffic there was outside the store, and he said he didn't know. What about the store's visitor rate? "I can't quite remember, only a few a day, and they don't buy anything." I asked him again about the try-on rate, but his answer was equally vague. It turned out he'd never recorded any data, let alone analyzed it. Instead of looking for the cause of his first loss, he blamed his luck. This will only lead to continued losses. He's lucky he can hold out for half a year. In fact, any store problem can be solved in the data. Here's the sales data calculation formula every brick-and-mortar store manager should keep track of.

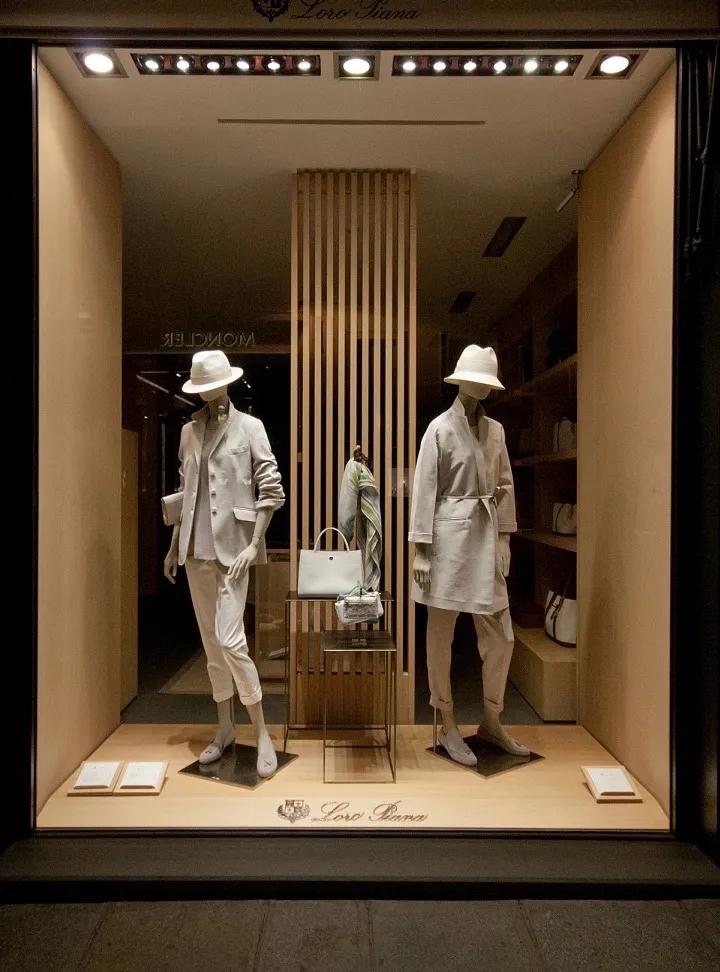
1. Sales Sales volume is the total amount of goods in the transaction. The shopping guide can record it in the daily report every day, and finally organize it into weekly and monthly summaries. Calculation formula: Sales = Number of store visits * Transaction rate * Average order value. In this formula, there are three indicators that directly affect sales: number of store visits, transaction rate, and average order value. Assume: 500 people pass by the store, 100 of them enter, 40 of them try on clothes, and 20 of them buy clothes. The average amount spent per person is 200 yuan. Then the sales volume is 100*20%*200=4000 yuan. The store entry rate is the ratio of customers passing through the store to entering the store. The customer entry rate is very important. Only when customers enter the store can there be sales. Calculation formula: Store entry rate = Number of people entering the store / Number of customers in front of the store * 100% If your store's entry rate is lower than that of nearby peers, you should consider how to improve it and reflect on why it's lower than nearby stores. There are many factors that can affect store entry rates, such as a lack of innovative design in the storefront retail mannequins or an unattractive theme in the window display, or advertising pop-ups. Assumption: 1,000 people pass by the store, and 200 of them enter.

3. Try-on rate
The try-on rate is the customer's experience rate. The store can use the store entry rate to test whether its products are attractive. If the attraction is not enough, use Mannequin props are used to create a themed layout to increase store visitor rates. Then, analyze whether the salesperson is persuasive enough to get customers to try on clothes. In daily sales, the try-on rate and closing rate are closely related. Most customers willing to take the time to try on clothes are motivated to buy, which is when the salesperson's skills are crucial. Calculation formula: Try-on rate = Number of people trying on clothes / Number of people entering the store * 100% Assume: 1,000 people pass by the store, 200 of them enter, and 80 try on clothes. The try-on rate is 80/200 * 100% = 40%.

4. Transaction rate
The transaction rate is determined by the overall factors of the store, including display, sales, promotion, advertising, and all aspects. Among the factors that increase the transaction rate, sales ability is very important. Shopping guides need to continue to learn and practice to improve their sales ability. Calculation formula: Transaction rate = Number of transactions / Number of people entering the store * 100 Assumption: 1,000 people passed by the store, 200 of them entered the store, 80 tried on clothes, and 50 paid. The transaction rate is 50/200*100%=25%

5. Joint rate and average order value
The joint rate reflects the sales level of the shopping guide. Smart shopping guides will promote related products, such as shoes, bags, and accessories, to increase the average order value. The average order value is the amount spent by each customer. It's influenced by the number of items purchased and the average price. Formula: Carryover Rate = Number of Items Sold / Number of Customers Transactional. Formula: Average Order Value = Total Amount / Total Number of Items. Assume: 1,000 people pass by a store, 200 of them enter, 80 try on items, and 50 purchase. A total of 80 items are sold, totaling 4,000 yuan. The carryover rate is 80/50 = 1.6, and the average order value is 4,000 yuan / 50 = 80 yuan.
These data need to be accurately recorded by the store manager every day, and then output into daily, weekly, and monthly reports. This will help the store manager to analyze the specific situation of the store based on these data during weekly or monthly reviews.
